How to provide direct feedback on survey results for your participants
2023-10-25
Abstract
This article outlines the implementation of graphical feedback for participants using SoSci Survey. By leveraging HTML, CSS, and JavaScript, the survey conductor can display individual feedback for each participant, enhancing engagement and improving data quality. Two chart types, a bar plot and a radar plot, are discussed in detail. Additionally, a downloadable PDF feature that complies with the General Data Protection Regulation is also presented. For direct usage, a practical example is provided for implementing the Big Five Inventory.

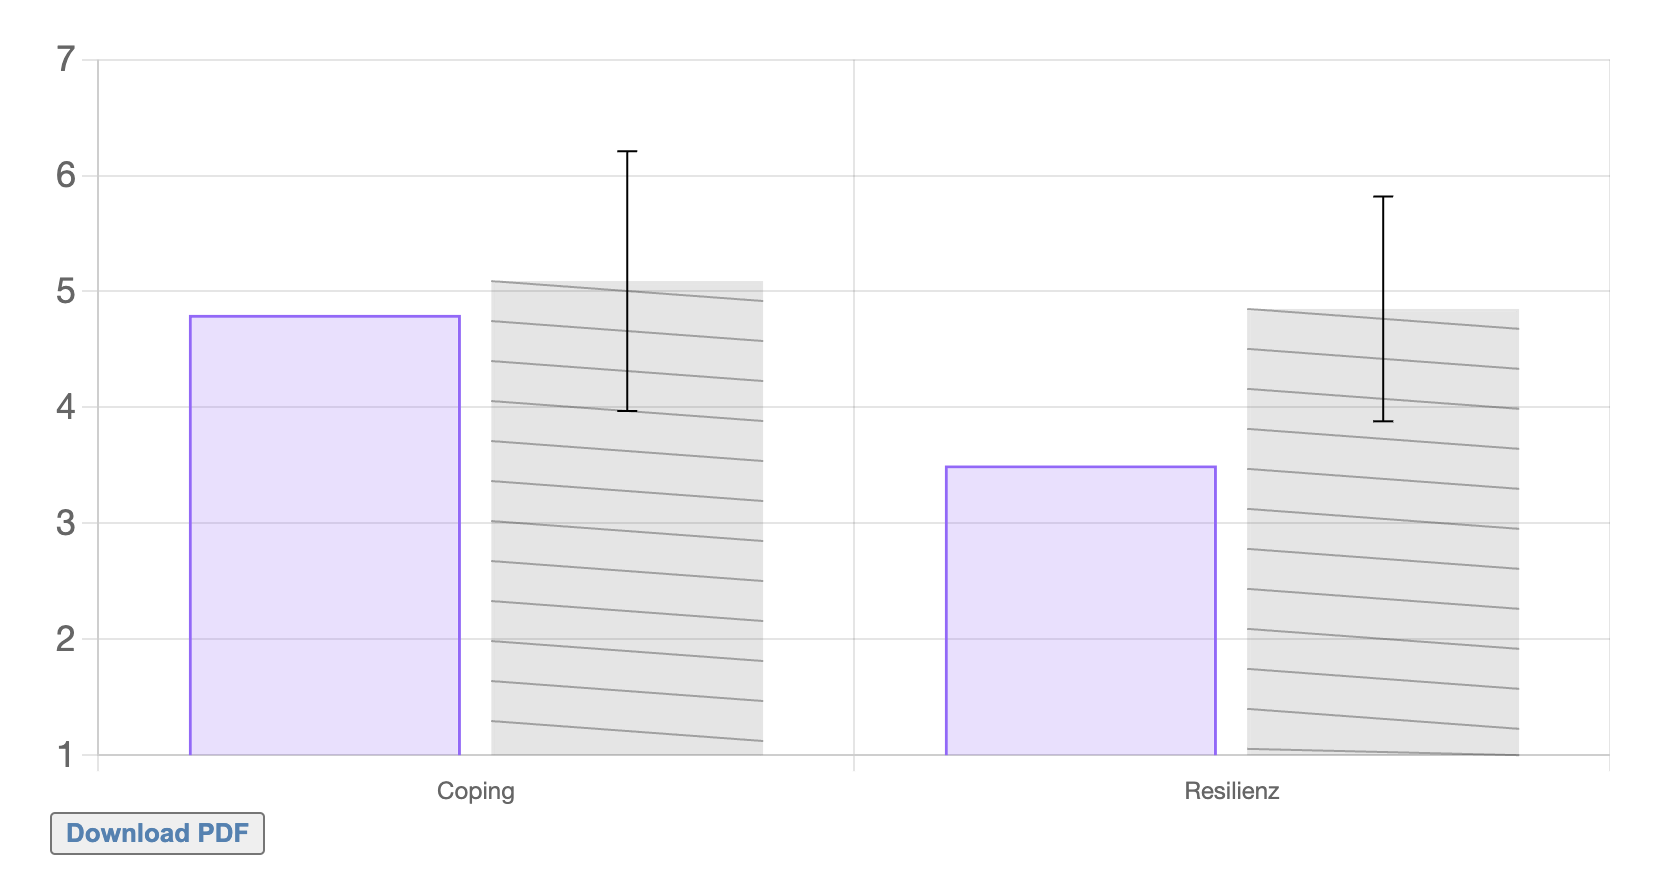
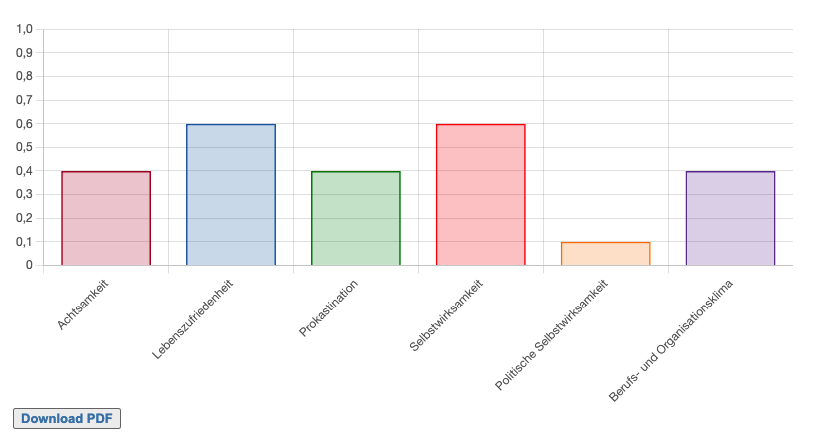
Figure 0.1: Top: Radar plot. Middle: Comparable bar plot with hatching and error bars. Bottom: Multiple bar plot.